Idealized Synthetic Data
Under development
import numpy as np
import pandas as pd
import xarray as xr
from IPython.display import display  # so can run as script too

from melodies_monet import driver
an = driver.analysis()
an.control = "control_idealized.yaml"
an.read_control()
an
analysis(
    control='control_idealized.yaml',
    control_dict=...,
    models={},
    obs={},
    paired={},
    start_time=Timestamp('2019-09-09 00:00:00'),
    end_time=Timestamp('2019-09-10 00:00:00'),
    time_intervals=None,
    download_maps=True,
    output_dir='./output/idealized',
    output_dir_save='./output/idealized',
    output_dir_read='./output/idealized',
    debug=True,
    save={'paired': {'method': 'netcdf', 'prefix': 'asdf', 'data': 'all'}},
    read={'paired': {'method': 'netcdf', 'filenames': {'test_obs_test_model': 'asdf_test_obs_test_model.nc4'}}},
    regrid=False,
)
Note: This is the complete file that was loaded.
control_idealized.yaml
 1analysis:
 2  start_time: "2019-09-09 00:00"
 3  end_time: "2019-09-10 00:00"
 4  output_dir: ./output/idealized
 5  # output_dir_save:  # defaults to `output_dir`
 6  # output_dir_read:  # defaults to `output_dir`
 7  debug: True
 8  save:
 9    paired:
10      method: 'netcdf' # 'netcdf' or 'pkl'
11      prefix: 'asdf' # use only with method=netcdf; don't set if you don't want a fn prefix
12      # output_name: '0905.pkl' # use only with method=pkl
13      data: 'all'
14      # ^ 'all' to save out all pairs or
15      #   ['pair1','pair2',...] to save out specific pairs.
16      #   With method='pkl' this is ignored and always saves all.
17    # models:
18    # obs:
19  read:
20    paired:
21      method: 'netcdf' # 'netcdf' or 'pkl'
22      filenames:
23        test_obs_test_model: 'asdf_test_obs_test_model.nc4'
24      # filenames: ['0904.pkl','0905.pkl'] # example for pkl method, uses str or iterable of filenames
25    # models:
26    # obs:
27
28model:
29  test_model:
30    files: test_model.nc
31    mod_type: random
32    variables:
33      A:
34        units: "Units of A"
35        unit_scale: 1
36        unit_scale_method: "*"
37      B:
38        units: "Units of B"
39        unit_scale: 1
40        unit_scale_method: "*"
41    mapping:
42      test_obs:
43        A: "A_obs"
44        B: "B_obs"
45    projection: ~  # unused
46
47obs:
48  test_obs:
49    # use_airnow: True
50    filename: test_obs.nc
51    obs_type: pt_sfc
52
53plots:
54  plot_grp1:
55    type: 'timeseries'
56    default_plot_kwargs:  # required (with at least one key)
57      linewidth: 2.0
58    domain_type: ['all']  # required
59    domain_name: ['CONUS']  # required
60    data: ['test_obs_test_model']  # required
61    data_proc:  # These four seem to be required for time series
62      rem_obs_nan: True  # True: Remove all points where model or obs variable is NaN. False: Remove only points where model variable is NaN.
63      ts_select_time: 'time'  # 'time' for UTC or 'time_local'
64      ts_avg_window: '3h'  # Options: None for no averaging or list pandas resample rule (e.g., 'h', 'D')
65      # ^ TODO: null setting seems not working
66      set_axis: False  # If True, add vmin_plot and vmax_plot for each variable in obs.
67
68  plot_grp2:
69    type: 'spatial_overlay'
70    fig_kwargs:
71      states: True
72      figsize: [10, 5]
73    domain_type: ['all']  # required
74    domain_name: ['CONUS']  # required
75    data: ['test_obs_test_model']  # required
76    data_proc:
77      rem_obs_nan: True
78      set_axis: True
Generate data
Model
Show code cell source
rs = np.random.RandomState(42)

control = an.control_dict

nlat = 100
nlon = 200

lon = np.linspace(-161, -60, nlon)
lat = np.linspace(18, 60, nlat)
Lon, Lat = np.meshgrid(lon, lat)

time = pd.date_range(control['analysis']['start_time'], control['analysis']['end_time'], freq="3H")
ntime = time.size

# Generate translating and expanding Gaussian
x_ = np.linspace(-1, 1, lon.size)
y_ = np.linspace(-1, 1, lat.size)
x, y = np.meshgrid(x_, y_)
mu = np.linspace(-0.5, 0.5, ntime)
sigma = np.linspace(0.3, 1, ntime)
g = np.exp(
    -(
        (
            (x[np.newaxis, ...] - mu[:, np.newaxis, np.newaxis])**2
            + y[np.newaxis, ...]**2
        ) / (
            2 * sigma[:, np.newaxis, np.newaxis]**2
        )
    )
)

# Coordinates
lat_da = xr.DataArray(lat, dims="lat", attrs={'longname': 'latitude', 'units': 'degN'}, name="lat")
lon_da = xr.DataArray(lon, dims="lon", attrs={'longname': 'longitude', 'units': 'degE'}, name="lon")
time_da = xr.DataArray(time, dims="time", name="time")

# Generate dataset
field_names = control['model']['test_model']['variables'].keys()
ds_dict = dict()
for field_name in field_names:
    units = control['model']['test_model']['variables'][field_name]['units']
    # data = rs.rand(ntime, nlat, nlon)
    data = g
    da = xr.DataArray(
        data,
        # coords={"lat": lat_da, "lon": lon_da, "time": time_da},
        coords=[time_da, lat_da, lon_da],
        dims=['time', 'lat', 'lon'],
        attrs={'units': units},
    )
    ds_dict[field_name] = da
ds = xr.Dataset(ds_dict).expand_dims("z", axis=1)
ds["z"] = [1]

ds_mod = ds
ds_mod
<xarray.Dataset> Size: 3MB
Dimensions:  (time: 9, lat: 100, lon: 200, z: 1)
Coordinates:
  * time     (time) datetime64[ns] 72B 2019-09-09 ... 2019-09-10
  * lat      (lat) float64 800B 18.0 18.42 18.85 19.27 ... 59.15 59.58 60.0
  * lon      (lon) float64 2kB -161.0 -160.5 -160.0 ... -61.02 -60.51 -60.0
  * z        (z) int64 8B 1
Data variables:
    A        (time, z, lat, lon) float64 1MB 0.000964 0.001019 ... 0.5379 0.5353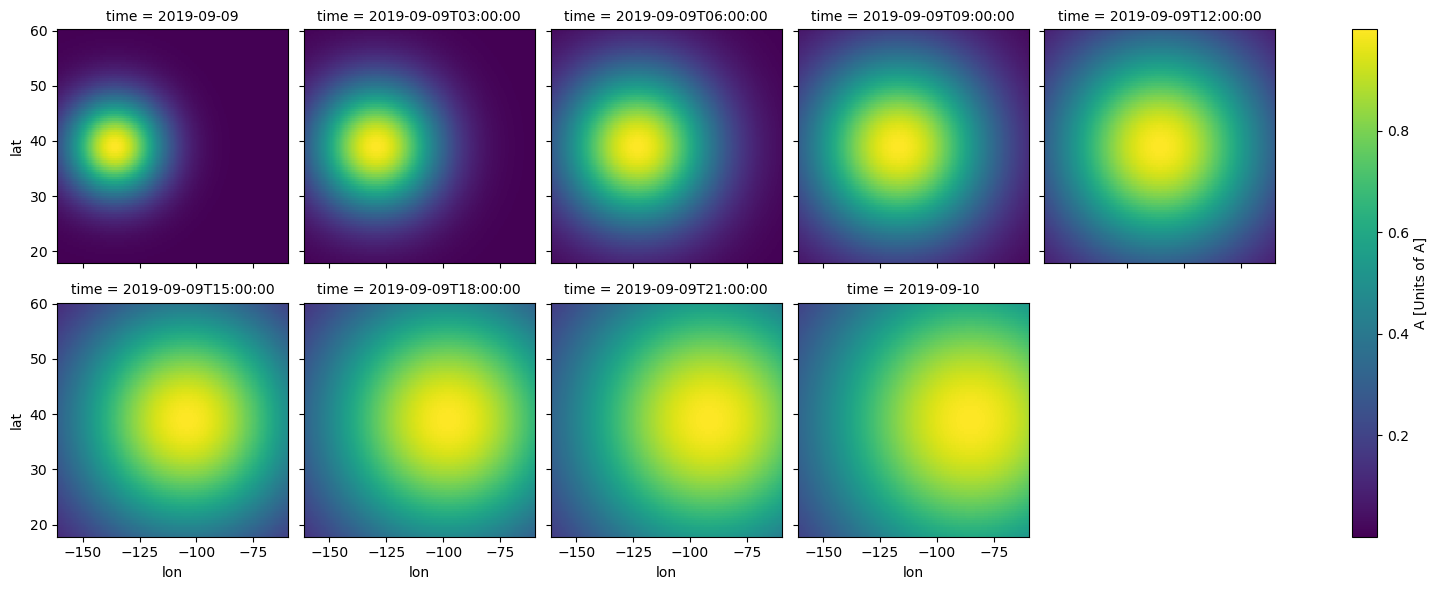
B (time, z, lat, lon) float64 1MB 0.000964 0.001019 ... 0.5379 0.5353ds.squeeze("z").A.plot(col="time", col_wrap=5, size=3);
ds.to_netcdf(control['model']['test_model']['files'])
Obs
Show code cell source
from string import ascii_lowercase

# Generate positions
# TODO: only within land boundaries would be cleaner
n = 500
lats = rs.uniform(lat[0], lat[-1], n)
lons = rs.uniform(lon[0], lon[-1], n)
siteid = np.array([f"{x:0{len(str(n))}}" for x in range(n)])[np.newaxis, :]
something_vlen = np.array(
    [
        "".join(rs.choice(list(ascii_lowercase), size=x, replace=True))
        for x in rs.randint(low=2, high=8, size=n)
    ],
    dtype=str,
)[np.newaxis, :]

# Generate dataset
field_names = control['model']['test_model']['variables'].keys()
ds_dict = dict()
for field_name0 in field_names:
    field_name = control['model']['test_model']['mapping']['test_obs'][field_name0]
    units = control['model']['test_model']['variables'][field_name0]['units']
    values = (
        ds_mod.A.squeeze().interp(lat=xr.DataArray(lats), lon=xr.DataArray(lons)).values
        + rs.normal(scale=0.3, size=(ntime, n))
    )[:, np.newaxis]
    da = xr.DataArray(
        values,
        coords={
            "x": ("x", np.arange(n)),  # !!!
            "time": ("time", time),
            "latitude": (("y", "x"), lats[np.newaxis, :], lat_da.attrs),
            "longitude": (("y", "x"), lons[np.newaxis, :], lon_da.attrs),
            "siteid": (("y", "x"), siteid),
            "something_vlen": (("y", "x"), something_vlen),
        },
        dims=("time", "y", "x"),
        attrs={'units': units},
    )
    ds_dict[field_name] = da
ds = xr.Dataset(ds_dict)
ds
<xarray.Dataset> Size: 104kB
Dimensions:         (x: 500, time: 9, y: 1)
Coordinates:
  * x               (x) int64 4kB 0 1 2 3 4 5 6 ... 493 494 495 496 497 498 499
  * time            (time) datetime64[ns] 72B 2019-09-09 ... 2019-09-10
    latitude        (y, x) float64 4kB 33.73 57.93 48.74 ... 21.26 58.92 59.42
    longitude       (y, x) float64 4kB -90.49 -106.9 -129.7 ... -65.03 -116.0
    siteid          (y, x) <U3 6kB '000' '001' '002' '003' ... '497' '498' '499'
    something_vlen  (y, x) <U7 14kB 'xicjs' 'cvoaglq' ... 'dzzfatw' 'poqhzl'
Dimensions without coordinates: y
Data variables:
    A_obs           (time, y, x) float64 36kB 0.21 0.1793 ... 0.118 0.6552
B_obs (time, y, x) float64 36kB -0.1099 -0.2269 ... 0.1155 0.6365ds.to_netcdf(control['obs']['test_obs']['filename'])
Load
an.open_models()
random
test_model.nc
**** Reading Unspecified model output. Take Caution...
an.models['test_model'].obj
Show code cell output
<xarray.Dataset> Size: 3MB
Dimensions:  (time: 9, lat: 100, lon: 200, z: 1)
Coordinates:
  * time     (time) datetime64[ns] 72B 2019-09-09 ... 2019-09-10
  * lat      (lat) float64 800B 18.0 18.42 18.85 19.27 ... 59.15 59.58 60.0
  * lon      (lon) float64 2kB -161.0 -160.5 -160.0 ... -61.02 -60.51 -60.0
  * z        (z) int64 8B 1
Data variables:
    A        (time, z, lat, lon) float64 1MB 0.000964 0.001019 ... 0.5379 0.5353
B (time, z, lat, lon) float64 1MB 0.000964 0.001019 ... 0.5379 0.5353an.open_obs()
an.obs['test_obs'].obj
Show code cell output
<xarray.Dataset> Size: 104kB
Dimensions:         (x: 500, time: 9, y: 1)
Coordinates:
  * x               (x) int64 4kB 0 1 2 3 4 5 6 ... 493 494 495 496 497 498 499
  * time            (time) datetime64[ns] 72B 2019-09-09 ... 2019-09-10
    latitude        (y, x) float64 4kB ...
    longitude       (y, x) float64 4kB ...
    siteid          (y, x) <U3 6kB ...
    something_vlen  (y, x) <U7 14kB ...
Dimensions without coordinates: y
Data variables:
    A_obs           (time, y, x) float64 36kB ...
B_obs (time, y, x) float64 36kB ...Pair
%%time

an.pair_data()
Show code cell output
1, in pair data
After pairing:                      time   latitude   longitude siteid something_vlen  \
0    2019-09-09 00:00:00  33.730685  -90.485667    000          xicjs
1    2019-09-09 03:00:00  33.730685  -90.485667    000          xicjs
2    2019-09-09 06:00:00  33.730685  -90.485667    000          xicjs
3    2019-09-09 09:00:00  33.730685  -90.485667    000          xicjs
4    2019-09-09 12:00:00  33.730685  -90.485667    000          xicjs
...                  ...        ...         ...    ...            ...
4495 2019-09-09 12:00:00  59.420851 -115.953417    499         poqhzl
4496 2019-09-09 15:00:00  59.420851 -115.953417    499         poqhzl
4497 2019-09-09 18:00:00  59.420851 -115.953417    499         poqhzl
4498 2019-09-09 21:00:00  59.420851 -115.953417    499         poqhzl
4499 2019-09-10 00:00:00  59.420851 -115.953417    499         poqhzl

         A_obs     B_obs         A         B
0     0.209983 -0.109890  0.008033  0.008033
1     0.171024  0.289535  0.111157  0.111157
2    -0.174732  0.634226  0.343373  0.343373
3     0.518397  0.673546  0.587818  0.587818
4     1.091830  1.225345  0.769533  0.769533
...        ...       ...       ...       ...
4495  0.160357  0.926215  0.316865  0.316865
4496  0.652020  0.369675  0.394017  0.394017
4497  0.713842  0.143496  0.450187  0.450187
4498  0.328453  0.524407  0.489130  0.489130
4499  0.655239  0.636502  0.515131  0.515131

[4500 rows x 9 columns]
saving pair
CPU times: user 78.4 ms, sys: 3.97 ms, total: 82.4 ms
Wall time: 84 ms
an.paired
{'test_obs_test_model': pair(
     type='pt_sfc',
     radius_of_influence=1000000.0,
     obs='test_obs',
     model='test_model',
     model_vars=['A', 'B'],
     obs_vars=['A_obs', 'B_obs'],
     filename='test_obs_test_model.nc',
 )}
an.paired['test_obs_test_model'].obj
<xarray.Dataset> Size: 196kB
Dimensions:         (time: 9, x: 500)
Coordinates:
  * time            (time) datetime64[ns] 72B 2019-09-09 ... 2019-09-10
  * x               (x) int64 4kB 0 1 2 3 4 5 6 ... 493 494 495 496 497 498 499
Data variables:
    something_vlen  (time, x) object 36kB 'xicjs' 'cvoaglq' ... 'poqhzl'
    A_obs           (time, x) float64 36kB 0.21 0.1793 0.1735 ... 0.118 0.6552
    B_obs           (time, x) float64 36kB -0.1099 -0.2269 ... 0.1155 0.6365
    A               (time, x) float64 36kB 0.008033 0.001784 ... 0.5939 0.5151
    B               (time, x) float64 36kB 0.008033 0.001784 ... 0.5939 0.5151
    latitude        (x) float64 4kB 33.73 57.93 48.74 ... 21.26 58.92 59.42
    longitude       (x) float64 4kB -90.49 -106.9 -129.7 ... -65.03 -116.0
siteid (x) object 4kB '000' '001' '002' '003' ... '497' '498' '499'an.paired['test_obs_test_model'].obj.dims
FrozenMappingWarningOnValuesAccess({'time': 9, 'x': 500})
Plot
%%time

an.plotting()
Warning: variables dict for A_obs not provided, so defaults used
/home/docs/checkouts/readthedocs.org/user_builds/melodies-monet/conda/v1.0/lib/python3.11/site-packages/cartopy/io/__init__.py:241: DownloadWarning: Downloading: https://naturalearth.s3.amazonaws.com/10m_physical/ne_10m_coastline.zip
  warnings.warn(f'Downloading: {url}', DownloadWarning)
/home/docs/checkouts/readthedocs.org/user_builds/melodies-monet/conda/v1.0/lib/python3.11/site-packages/cartopy/io/__init__.py:241: DownloadWarning: Downloading: https://naturalearth.s3.amazonaws.com/50m_cultural/ne_50m_admin_0_boundary_lines_land.zip
  warnings.warn(f'Downloading: {url}', DownloadWarning)
/home/docs/checkouts/readthedocs.org/user_builds/melodies-monet/conda/v1.0/lib/python3.11/site-packages/cartopy/io/__init__.py:241: DownloadWarning: Downloading: https://naturalearth.s3.amazonaws.com/10m_cultural/ne_10m_admin_1_states_provinces_lines.zip
  warnings.warn(f'Downloading: {url}', DownloadWarning)
Warning: variables dict for B_obs not provided, so defaults used
CPU times: user 3.94 s, sys: 170 ms, total: 4.1 s
Wall time: 5.58 s
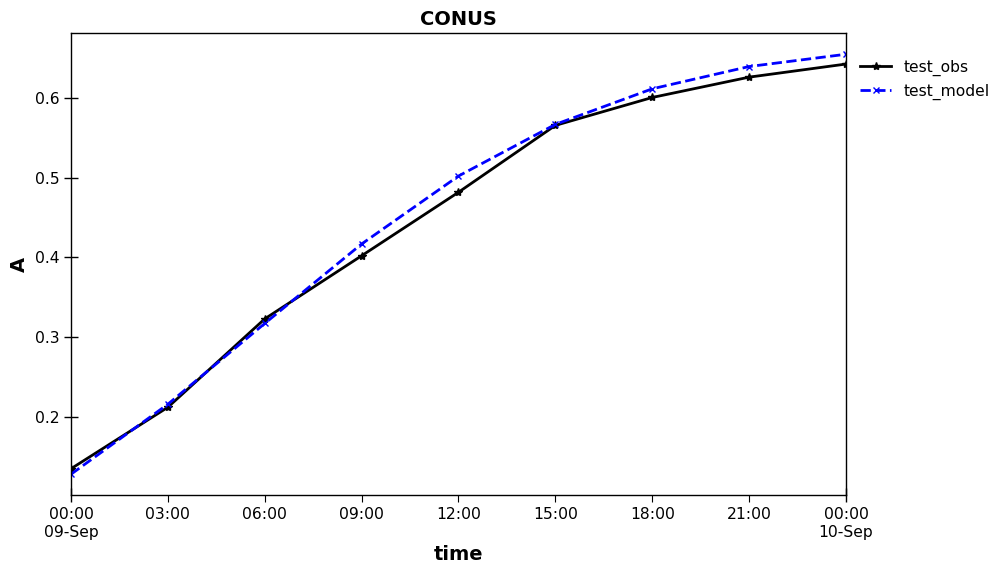
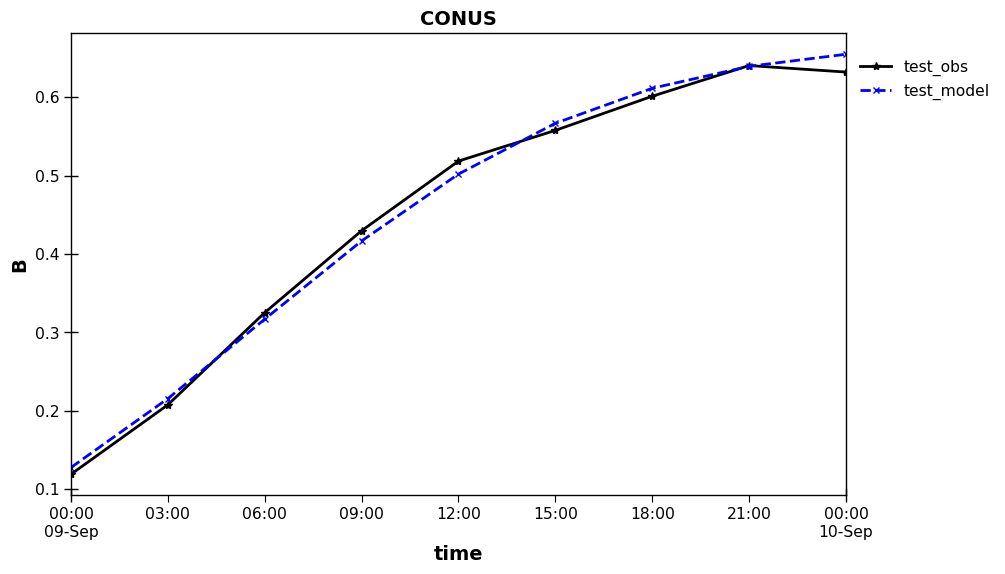
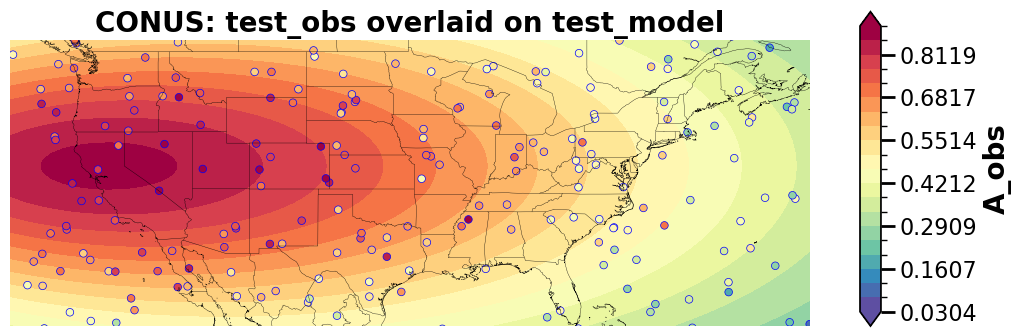
Save/load paired data – netCDF
And compare to the original pair object.
from copy import deepcopy

p0 = deepcopy(an.paired['test_obs_test_model'].obj)

an.save_analysis()
an.read_analysis()
p1 = deepcopy(an.paired['test_obs_test_model'].obj)
p1.close()

display(p0)
display(p1)
assert p1 is not p0 and p1.equals(p0)
Writing: ./output/idealized/asdf_test_obs_test_model.nc4
Reading: ./output/idealized/asdf_test_obs_test_model.nc4
<xarray.Dataset> Size: 196kB
Dimensions:         (time: 9, x: 500)
Coordinates:
  * time            (time) datetime64[ns] 72B 2019-09-09 ... 2019-09-10
  * x               (x) int64 4kB 0 1 2 3 4 5 6 ... 493 494 495 496 497 498 499
Data variables:
    something_vlen  (time, x) object 36kB 'xicjs' 'cvoaglq' ... 'poqhzl'
    A_obs           (time, x) float64 36kB 0.21 0.1793 0.1735 ... 0.118 0.6552
    B_obs           (time, x) float64 36kB -0.1099 -0.2269 ... 0.1155 0.6365
    A               (time, x) float64 36kB 0.008033 0.001784 ... 0.5939 0.5151
    B               (time, x) float64 36kB 0.008033 0.001784 ... 0.5939 0.5151
    latitude        (x) float64 4kB 33.73 57.93 48.74 ... 21.26 58.92 59.42
    longitude       (x) float64 4kB -90.49 -106.9 -129.7 ... -65.03 -116.0
siteid (x) object 4kB '000' '001' '002' '003' ... '497' '498' '499'<xarray.Dataset> Size: 288kB
Dimensions: (time: 9, x: 500)
Coordinates:
* time (time) datetime64[ns] 72B 2019-09-09 ... 2019-09-10
* x (x) int64 4kB 0 1 2 3 4 5 6 ... 493 494 495 496 497 498 499
Data variables:
something_vlen (time, x) <U7 126kB ...
A_obs (time, x) float64 36kB ...
B_obs (time, x) float64 36kB ...
A (time, x) float64 36kB ...
B (time, x) float64 36kB ...
latitude (x) float64 4kB ...
longitude (x) float64 4kB ...
siteid (x) <U3 6kB ...
Attributes:
title:
format: NetCDF-4
date_created: 2025-06-30
dict_json: {\n "type": "pt_sfc",\n "radius_of_influence": 10000...
group_name: test_obs_test_modelSave/load paired data – Python object
print(an.save)
an.save["paired"]["method"] = "pkl"
del an.save["paired"]["prefix"]
# We could leave `prefix` since unused, but we need to set `output_name`
an.save["paired"]["output_name"] = "asdf.joblib"
print("->", an.save)
print()
print(an.read)
an.read["paired"]["method"] = "pkl"
an.read["paired"]["filenames"] = "asdf.joblib"
print("->", an.read)
print()
an.save_analysis()
an.read_analysis()
p2 = deepcopy(an.paired['test_obs_test_model'].obj)
p2.close()
# display(p0)
display(p2)
assert p2 is not p0 and p2.equals(p0)
{'paired': {'method': 'netcdf', 'prefix': 'asdf', 'data': 'all'}}
-> {'paired': {'method': 'pkl', 'data': 'all', 'output_name': 'asdf.joblib'}}
{'paired': {'method': 'netcdf', 'filenames': {'test_obs_test_model': ['./output/idealized/asdf_test_obs_test_model.nc4']}}}
-> {'paired': {'method': 'pkl', 'filenames': 'asdf.joblib'}}
Writing: ./output/idealized/asdf.joblib
Reading: ./output/idealized/asdf.joblib
<xarray.Dataset> Size: 288kB
Dimensions:         (time: 9, x: 500)
Coordinates:
  * time            (time) datetime64[ns] 72B 2019-09-09 ... 2019-09-10
  * x               (x) int64 4kB 0 1 2 3 4 5 6 ... 493 494 495 496 497 498 499
Data variables:
    something_vlen  (time, x) <U7 126kB ...
    A_obs           (time, x) float64 36kB ...
    B_obs           (time, x) float64 36kB ...
    A               (time, x) float64 36kB ...
    B               (time, x) float64 36kB ...
    latitude        (x) float64 4kB ...
    longitude       (x) float64 4kB ...
    siteid          (x) <U3 6kB ...
Attributes:
    title:
    format:        NetCDF-4
    date_created:  2025-06-30
    dict_json:     {\n    "type": "pt_sfc",\n    "radius_of_influence": 10000...
    group_name:    test_obs_test_model