Supported Plots
Model to Model Comparisons
Under development.
See the Spatial Verification in MELODIES-MONET project on GitHub to learn about current and future development.
Model to Observation Comparisons
Surface Evaluation
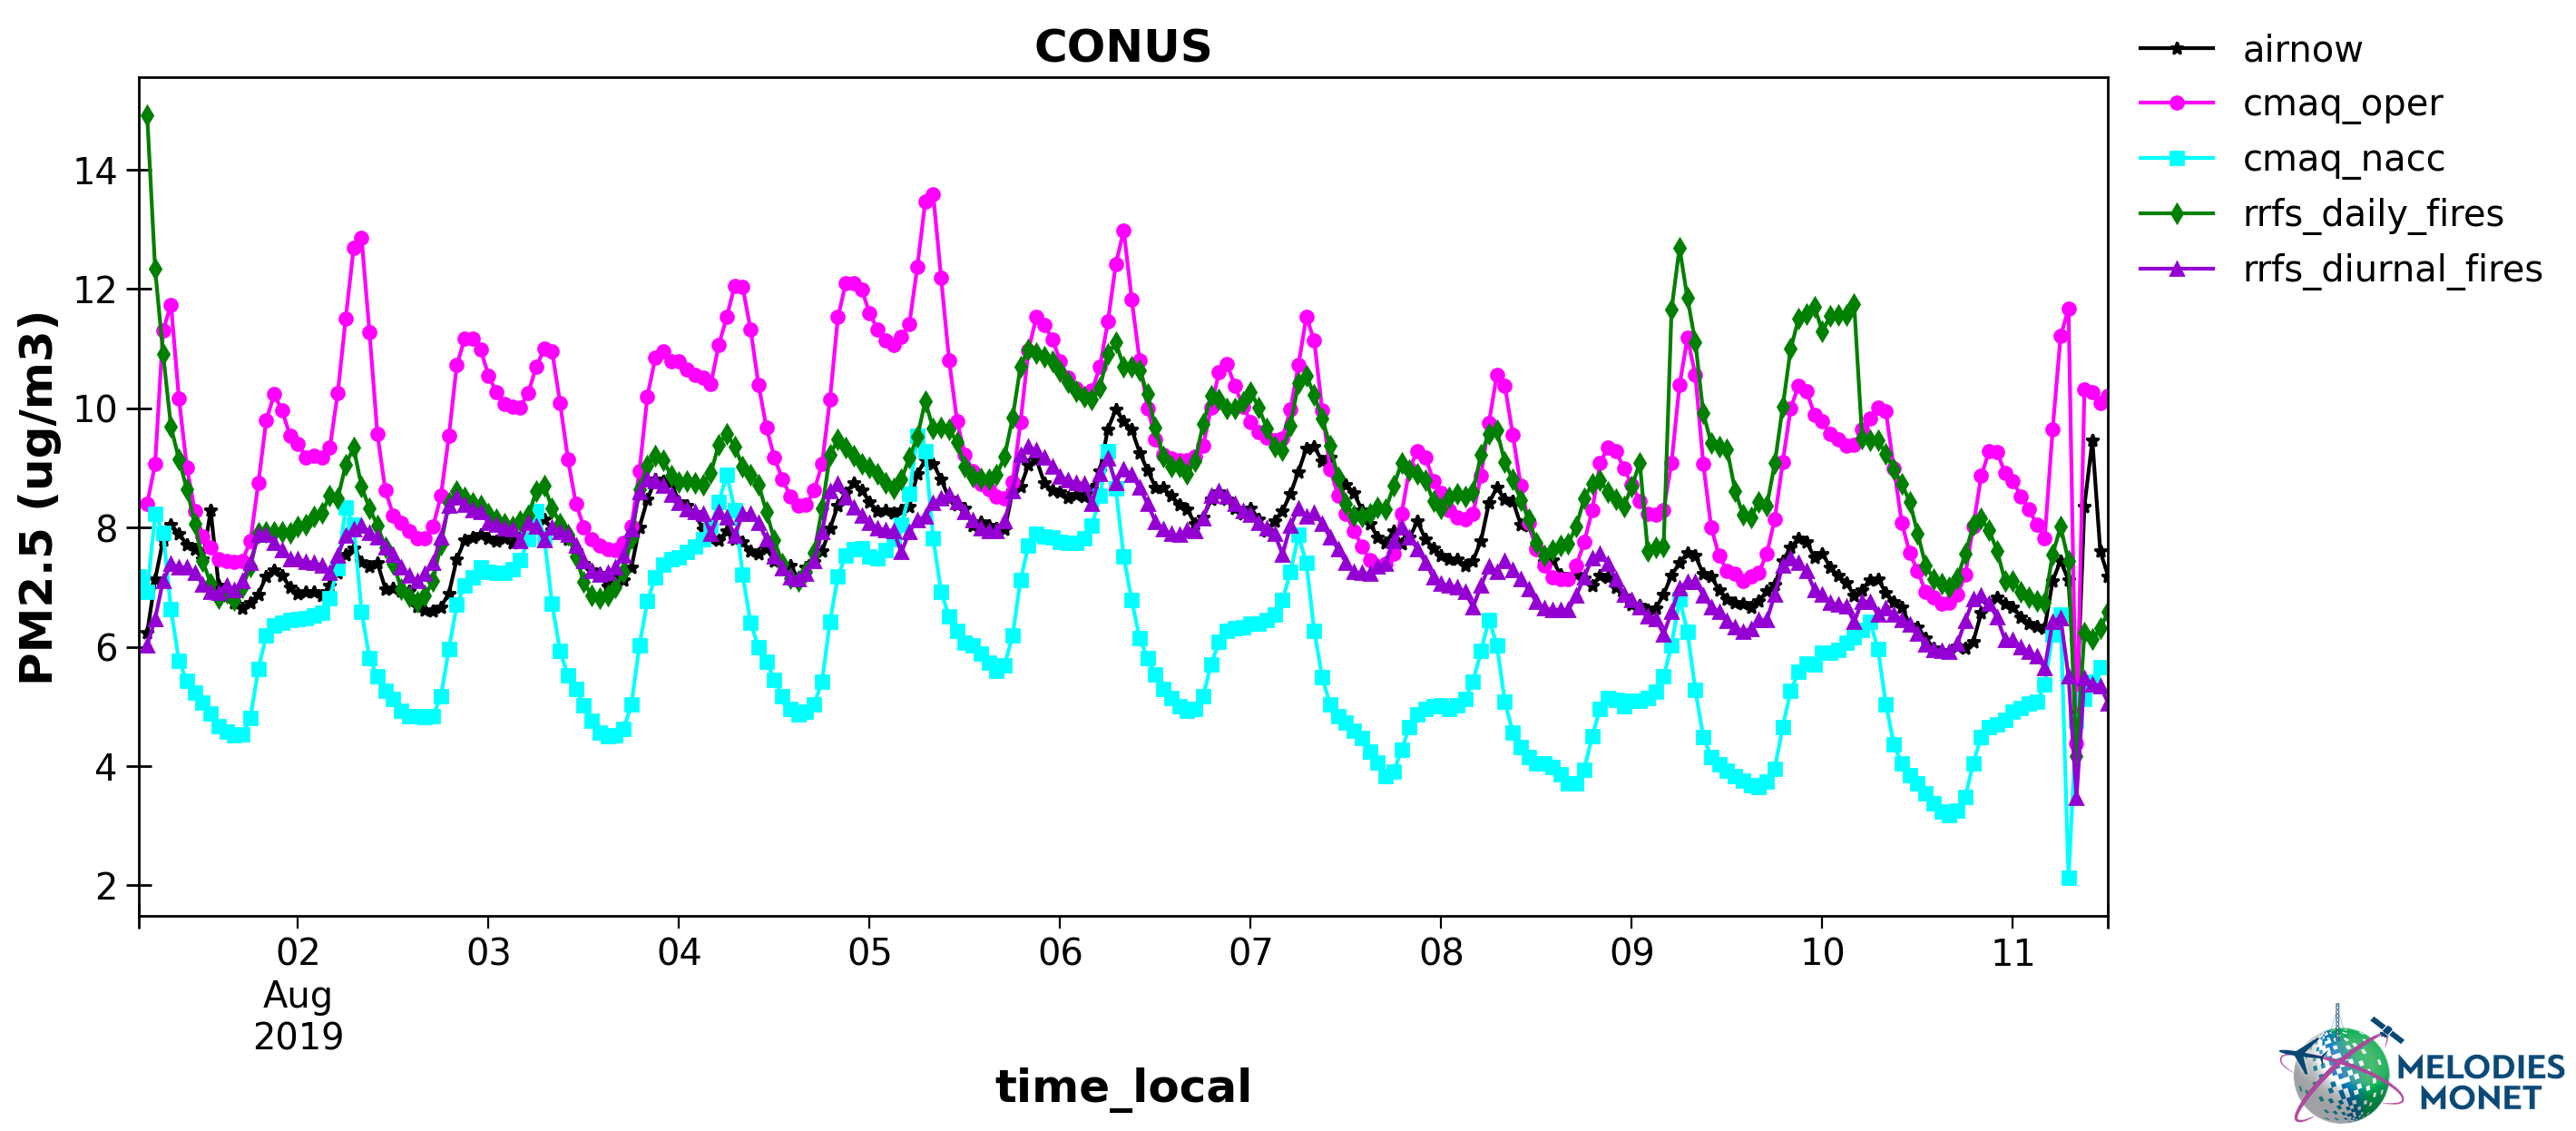
Timeseries - Plot comparing one or more model results with one observation (y-axis) versus time (x-axis) over the analysis window with options to specify the domain, time (local or UTC), and averaging window.
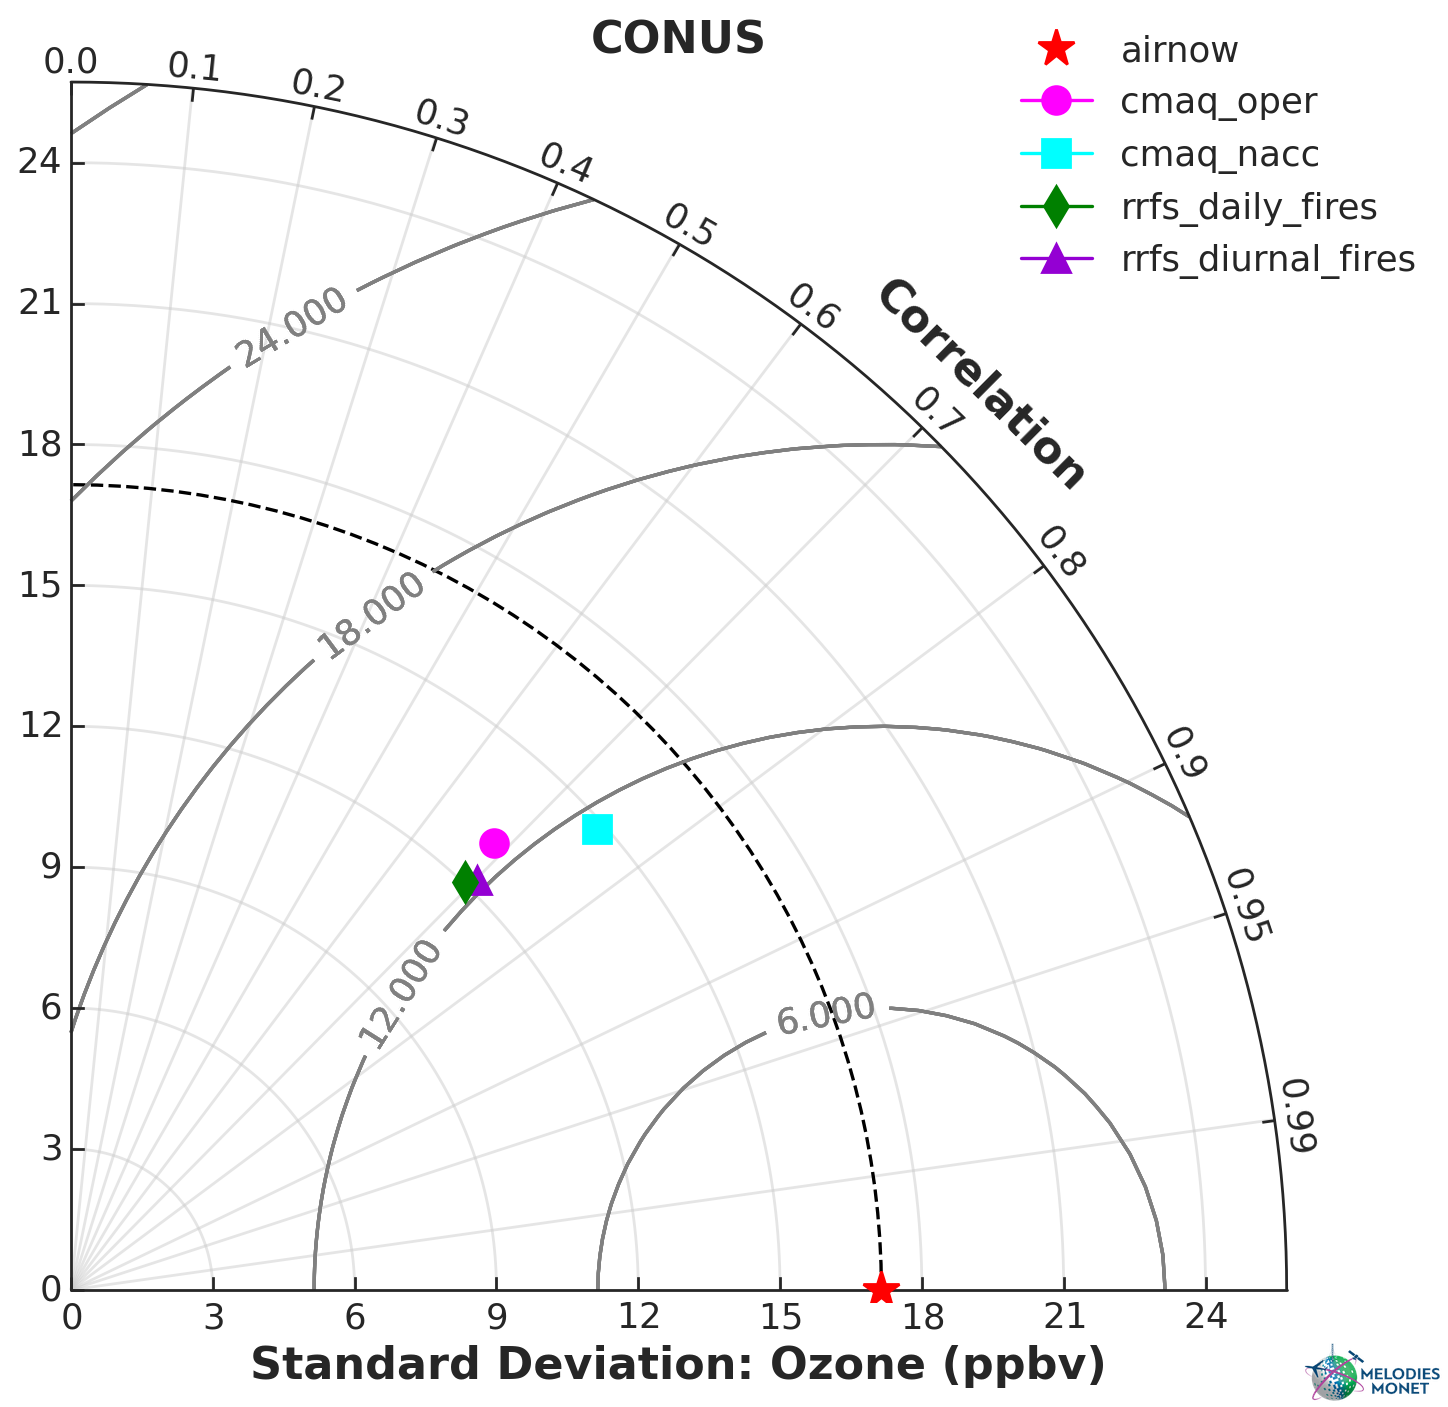
Taylor - Taylor plot comparing one or more model results with one observation over the analysis window with options to specify the domain.
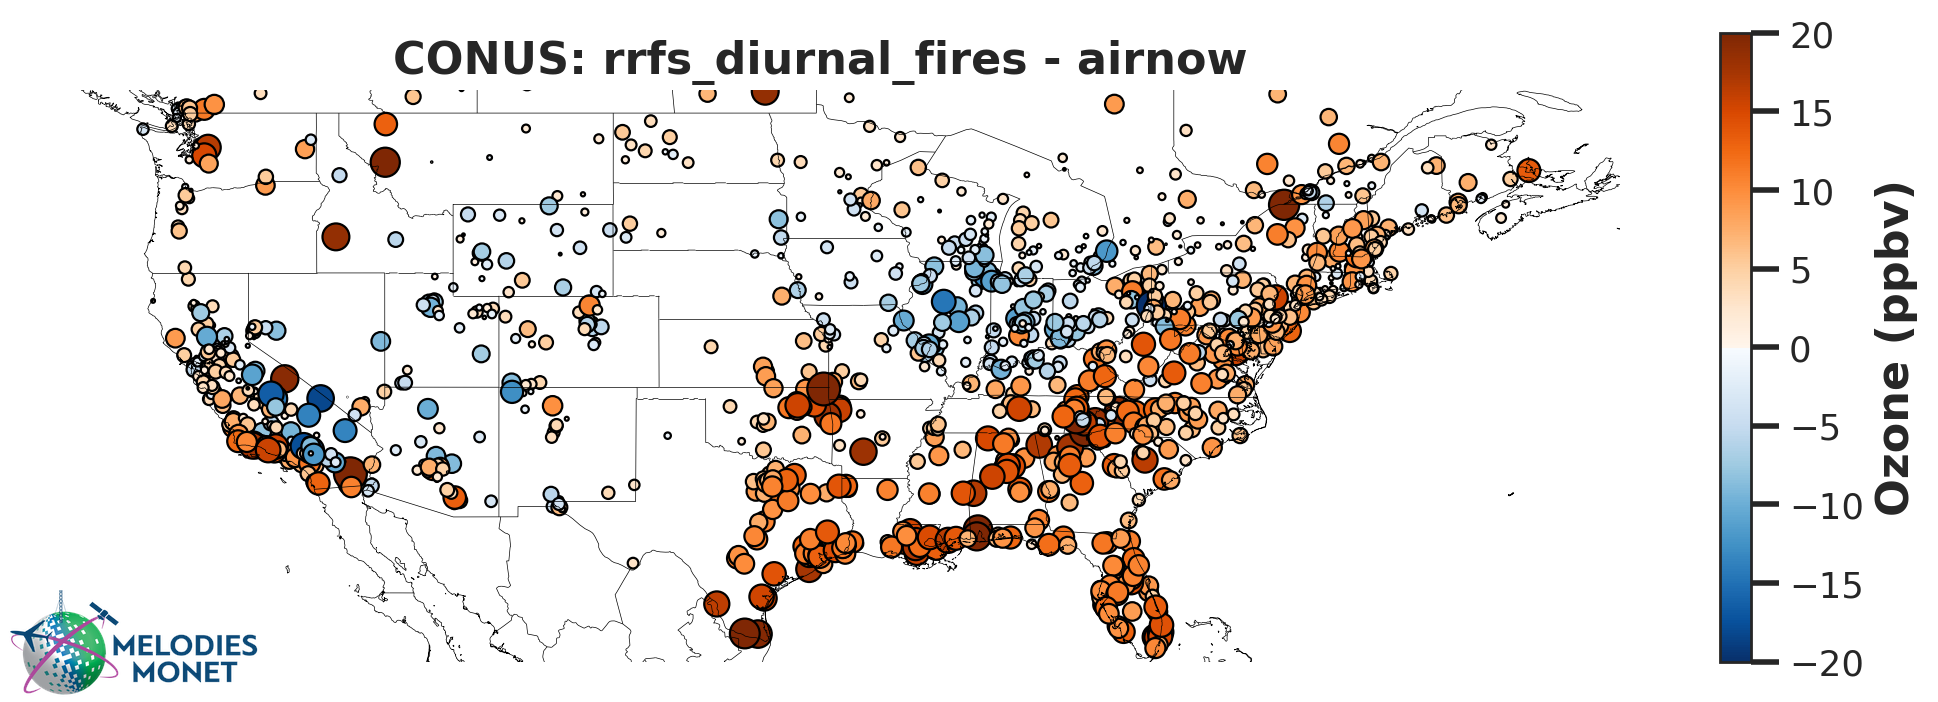
Spatial Bias - Difference plot of model - observations averaged over the analysis window with options to specify the domain. Defaults to average, but users can also optionally plot percentiles.
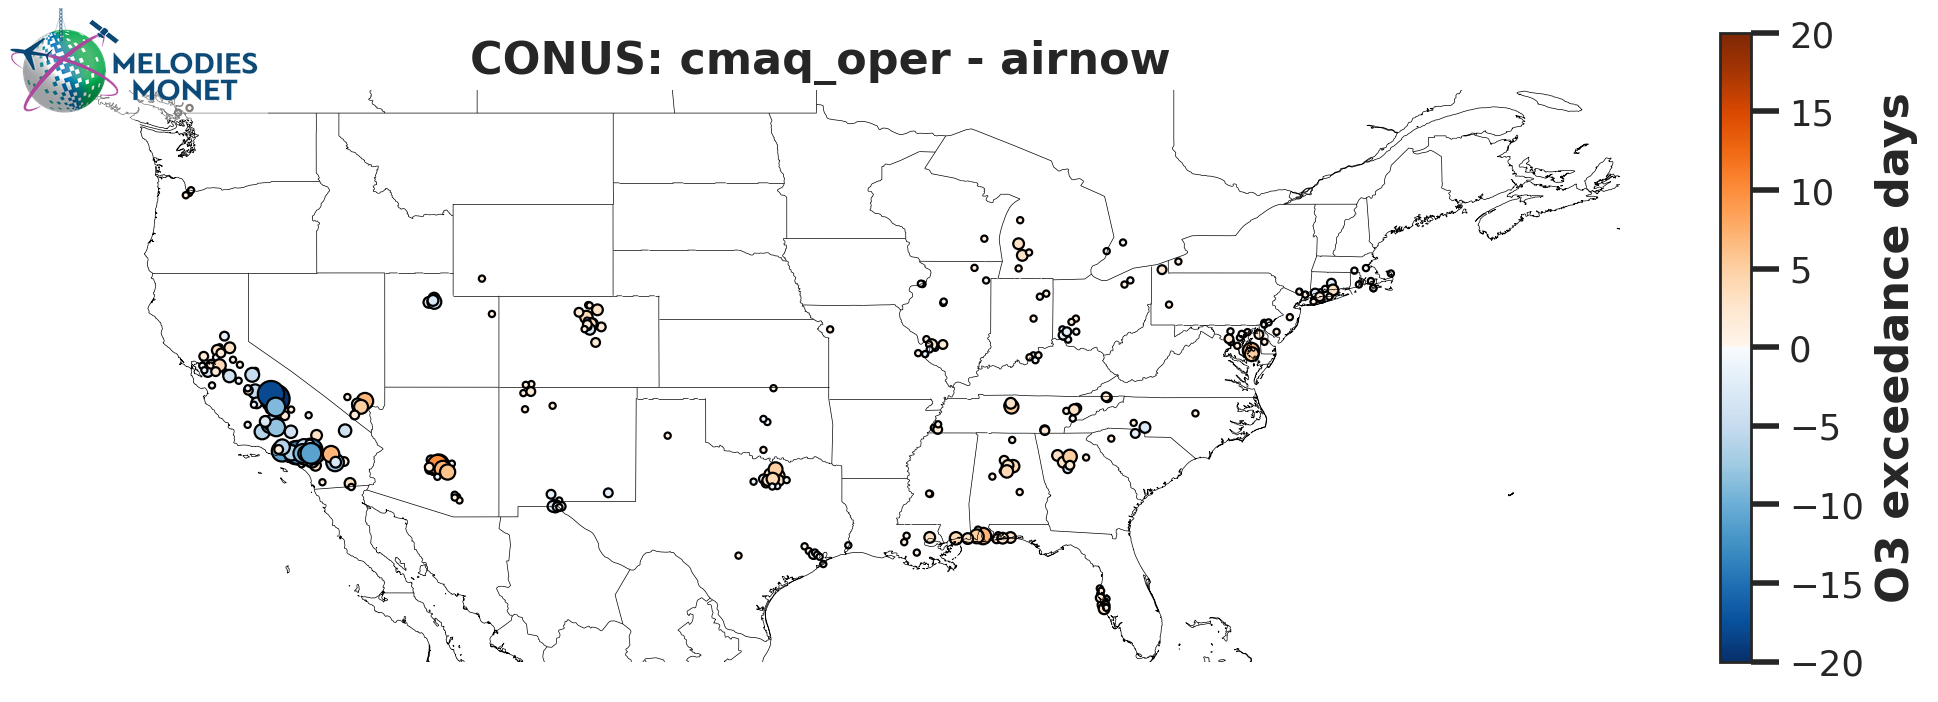
Spatial Bias Exceedance - Difference plot of model - observations for the number of
exceedances greater than the regulatory standard within the analysis window with options to specify
the domain. This only works for regulatory calculations (regulatory = True) for variables “OZONE” and “PM2.5” and units must be in ppbv or μg m-3, respectively, after the unit_scale option in the control file is applied.
An exceedance occurs when MDA8 ozone is greater than 70 ppbv or 24 hour averaged PM2.5 is
greater than 35 ug m-3.
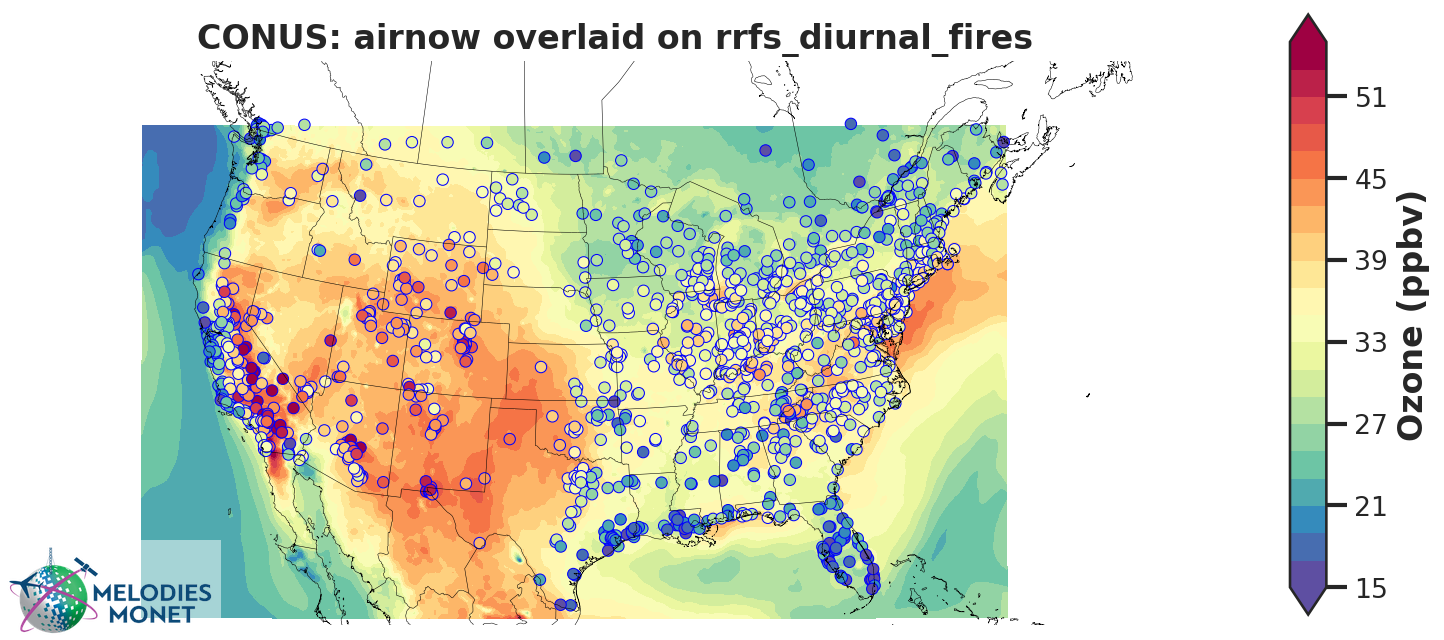
Spatial Overlay - Model results in contours with observational results overlaid in markers averaged over the analysis window with options to specify the domain.
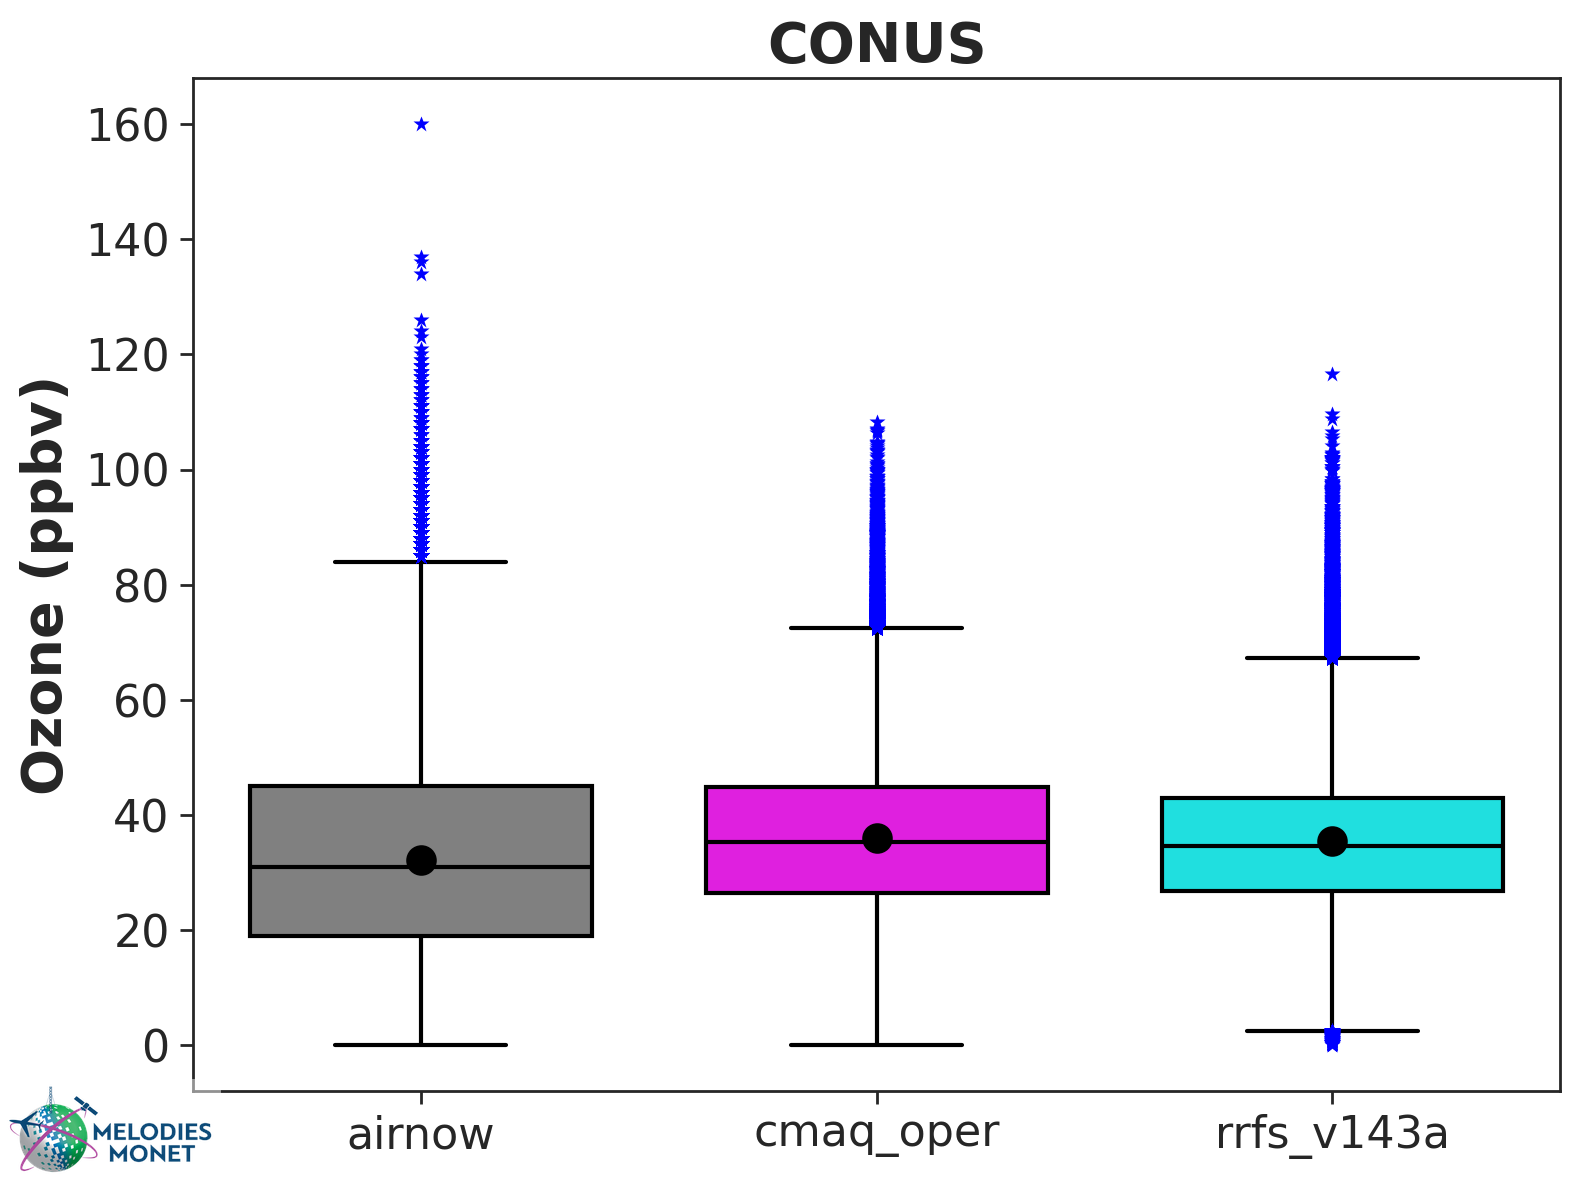
BOX-plot - BOX-plot comparing one or more model results with one observation over the analysis window with options to specify the domain.
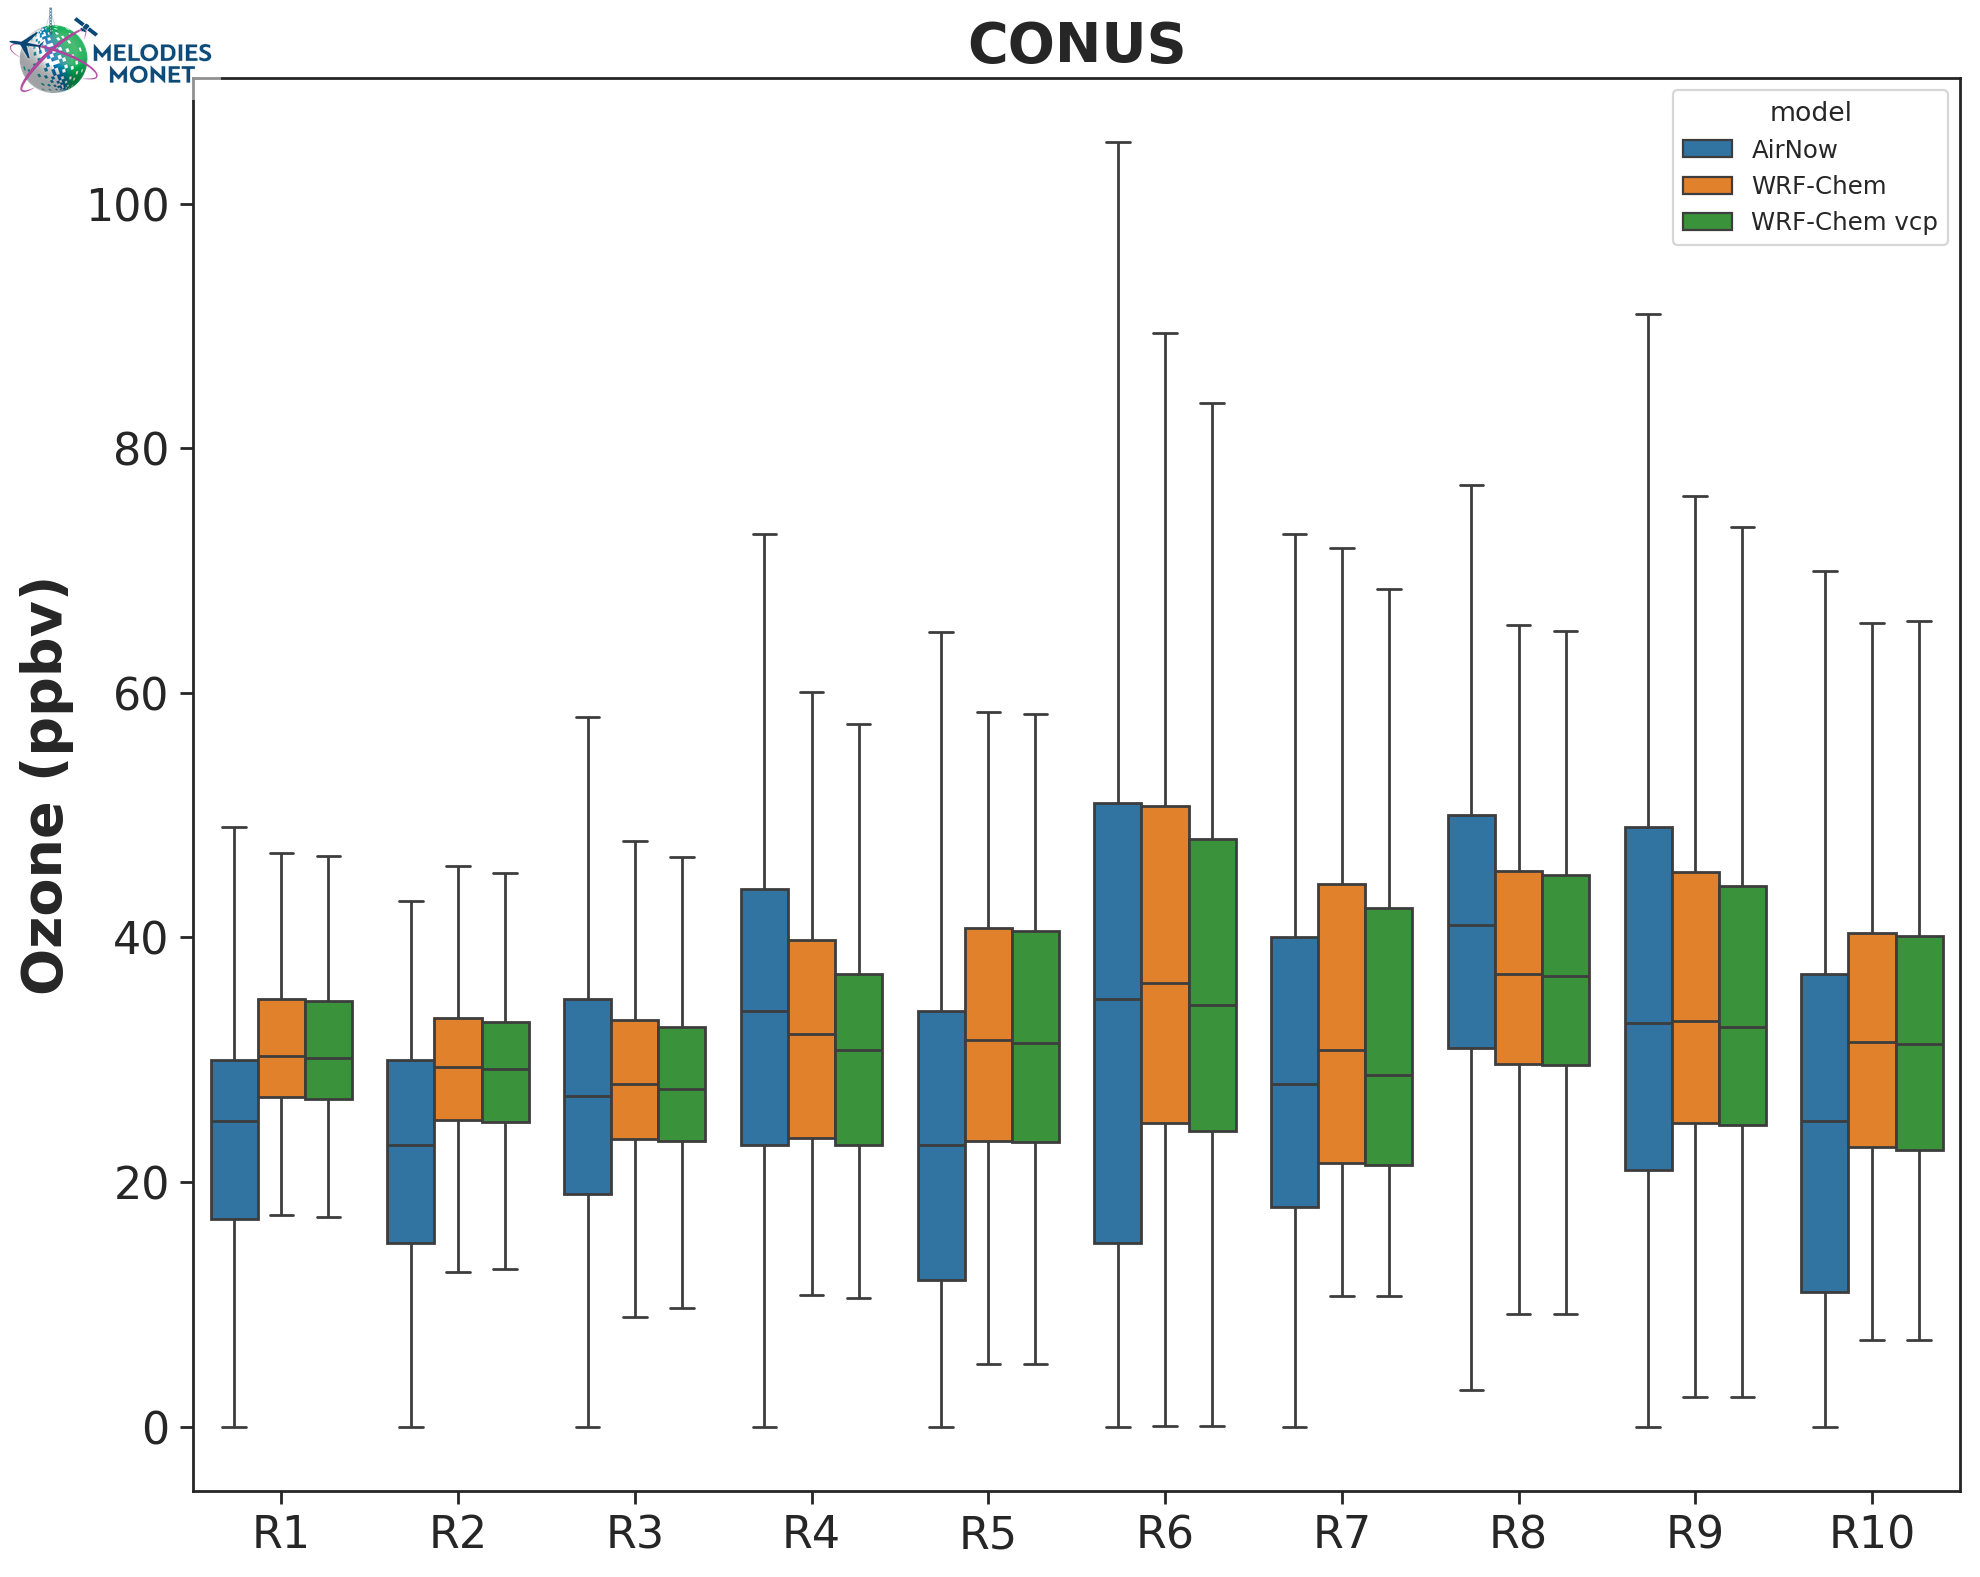
Multi-BOX-plot - Like BOX-plot, but including multiple regions.
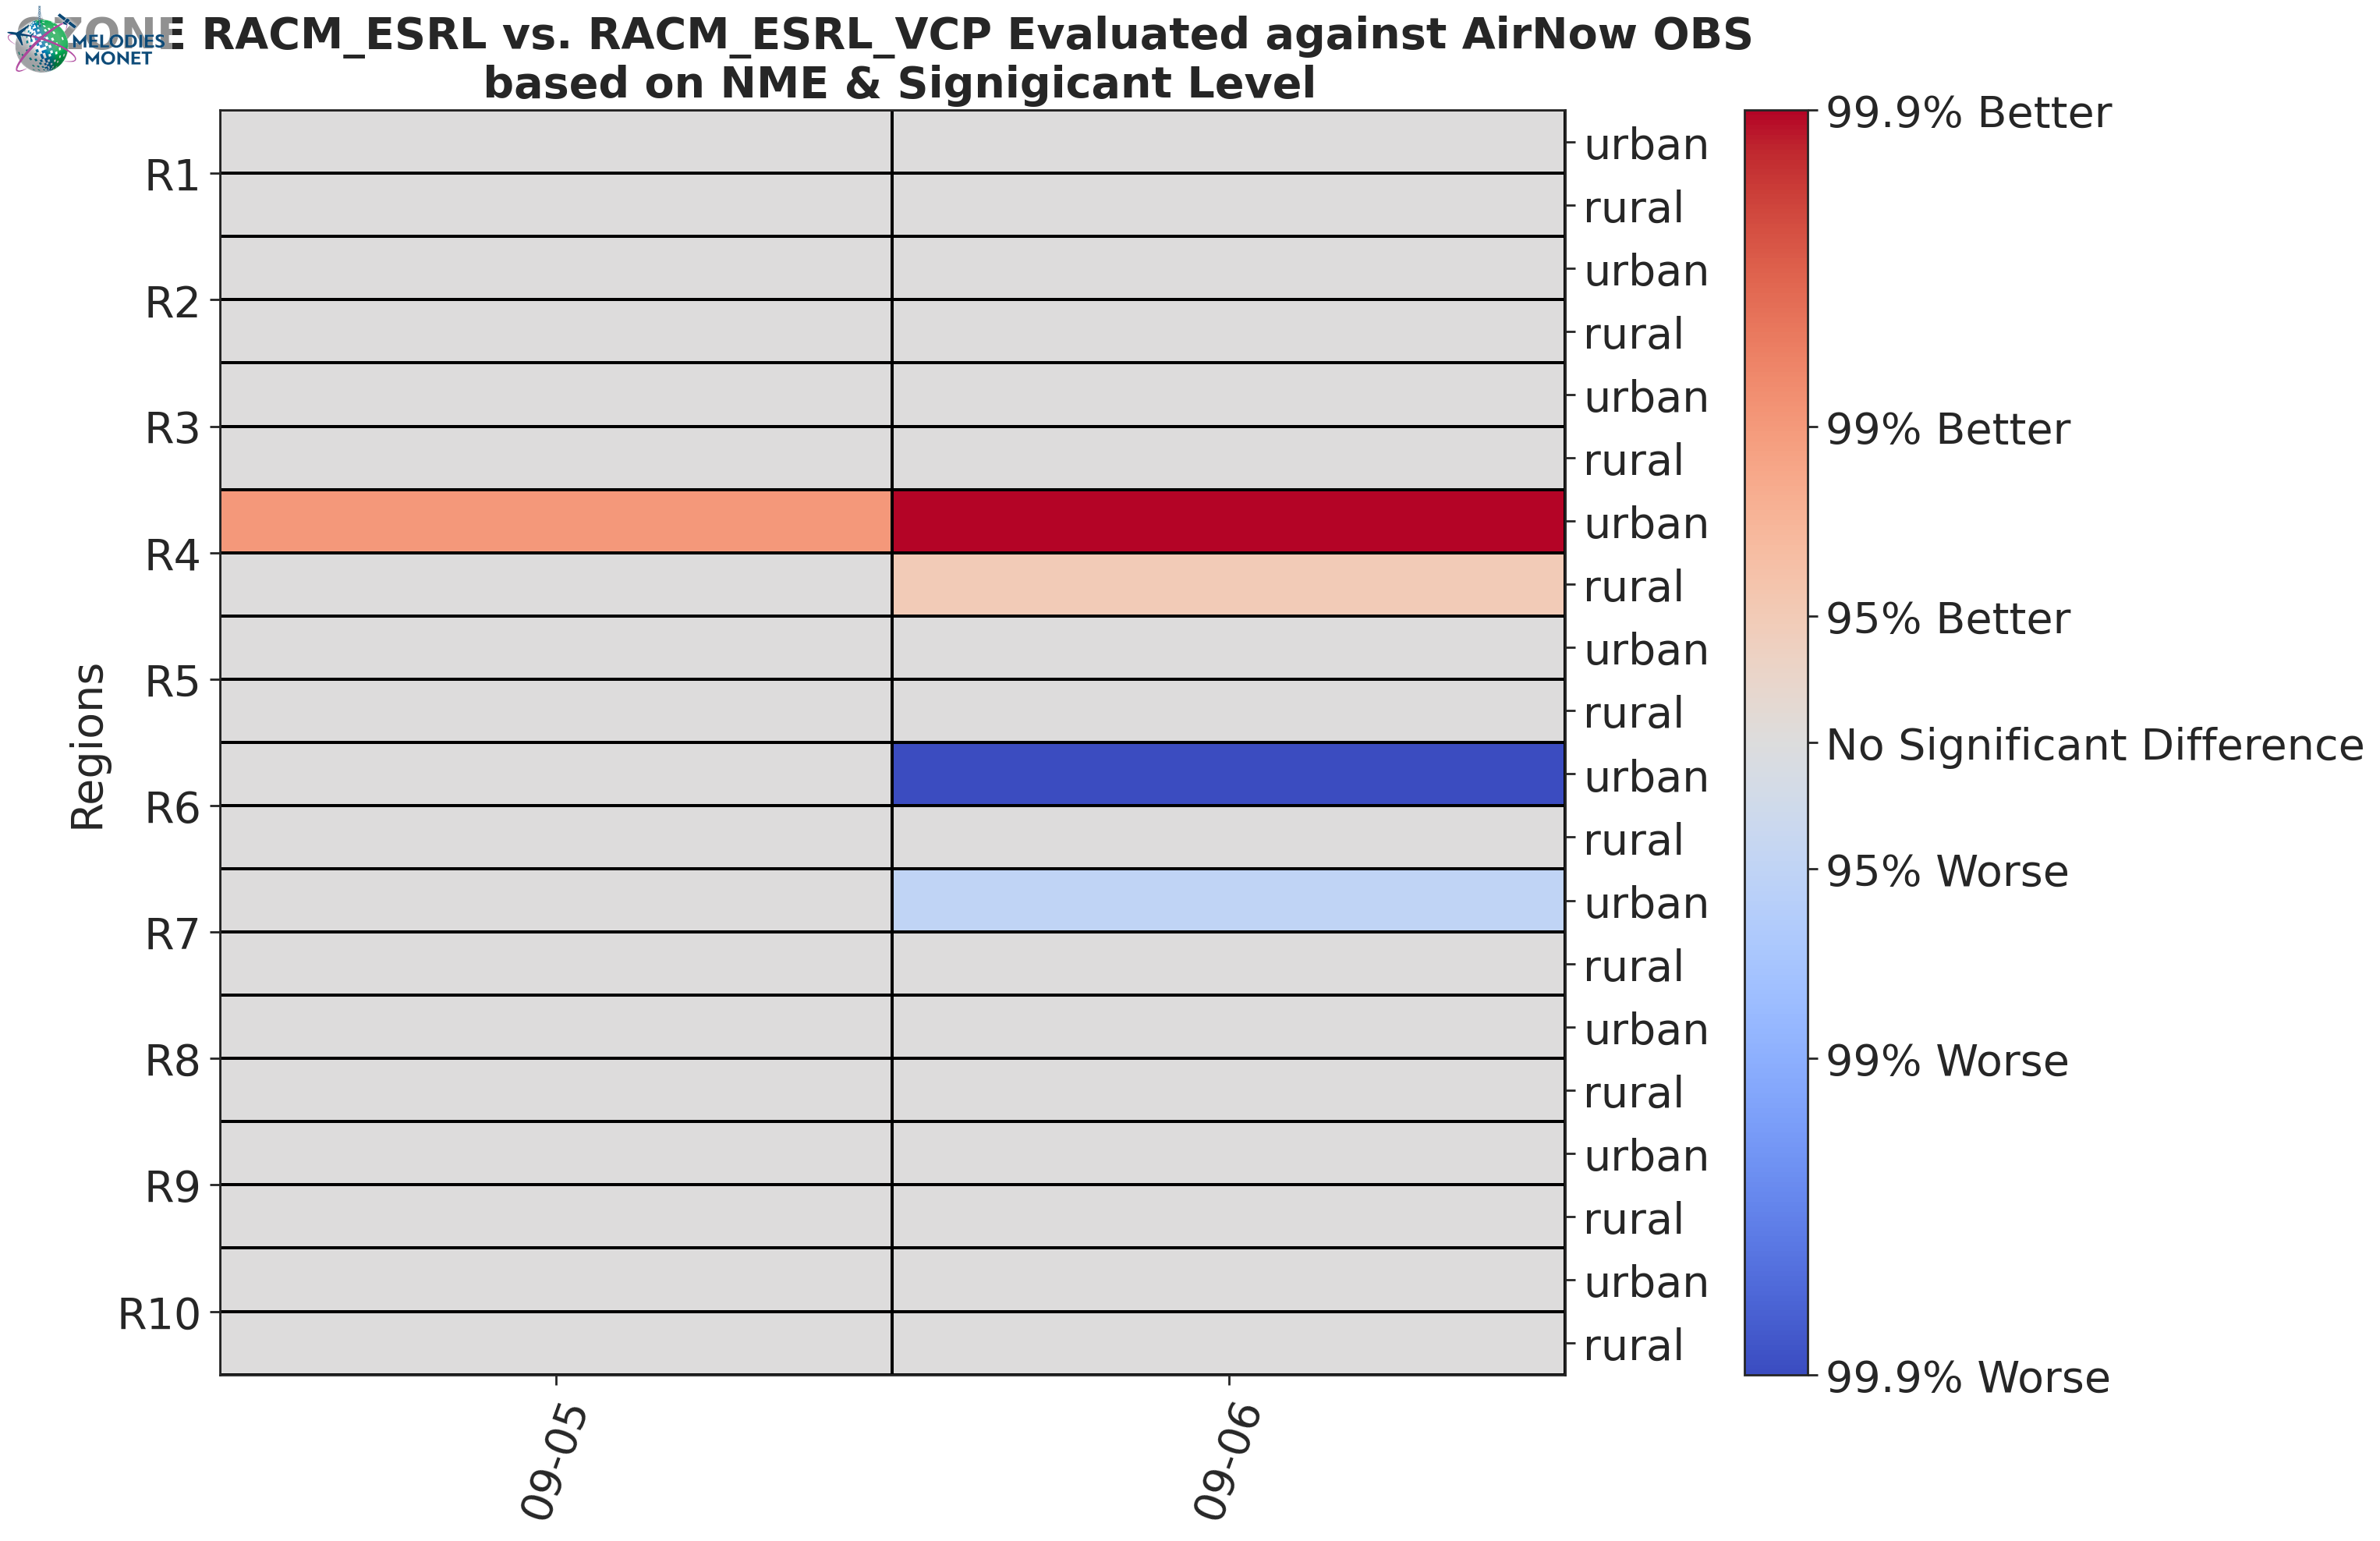
Scorecard - Compares two model outputs, evaluated against observations. The evaluation statistical parameters can be the Root Mean Square (RMSE), the Normalized Mean Bias (NMB) or the Index Of Agreement (IOA).
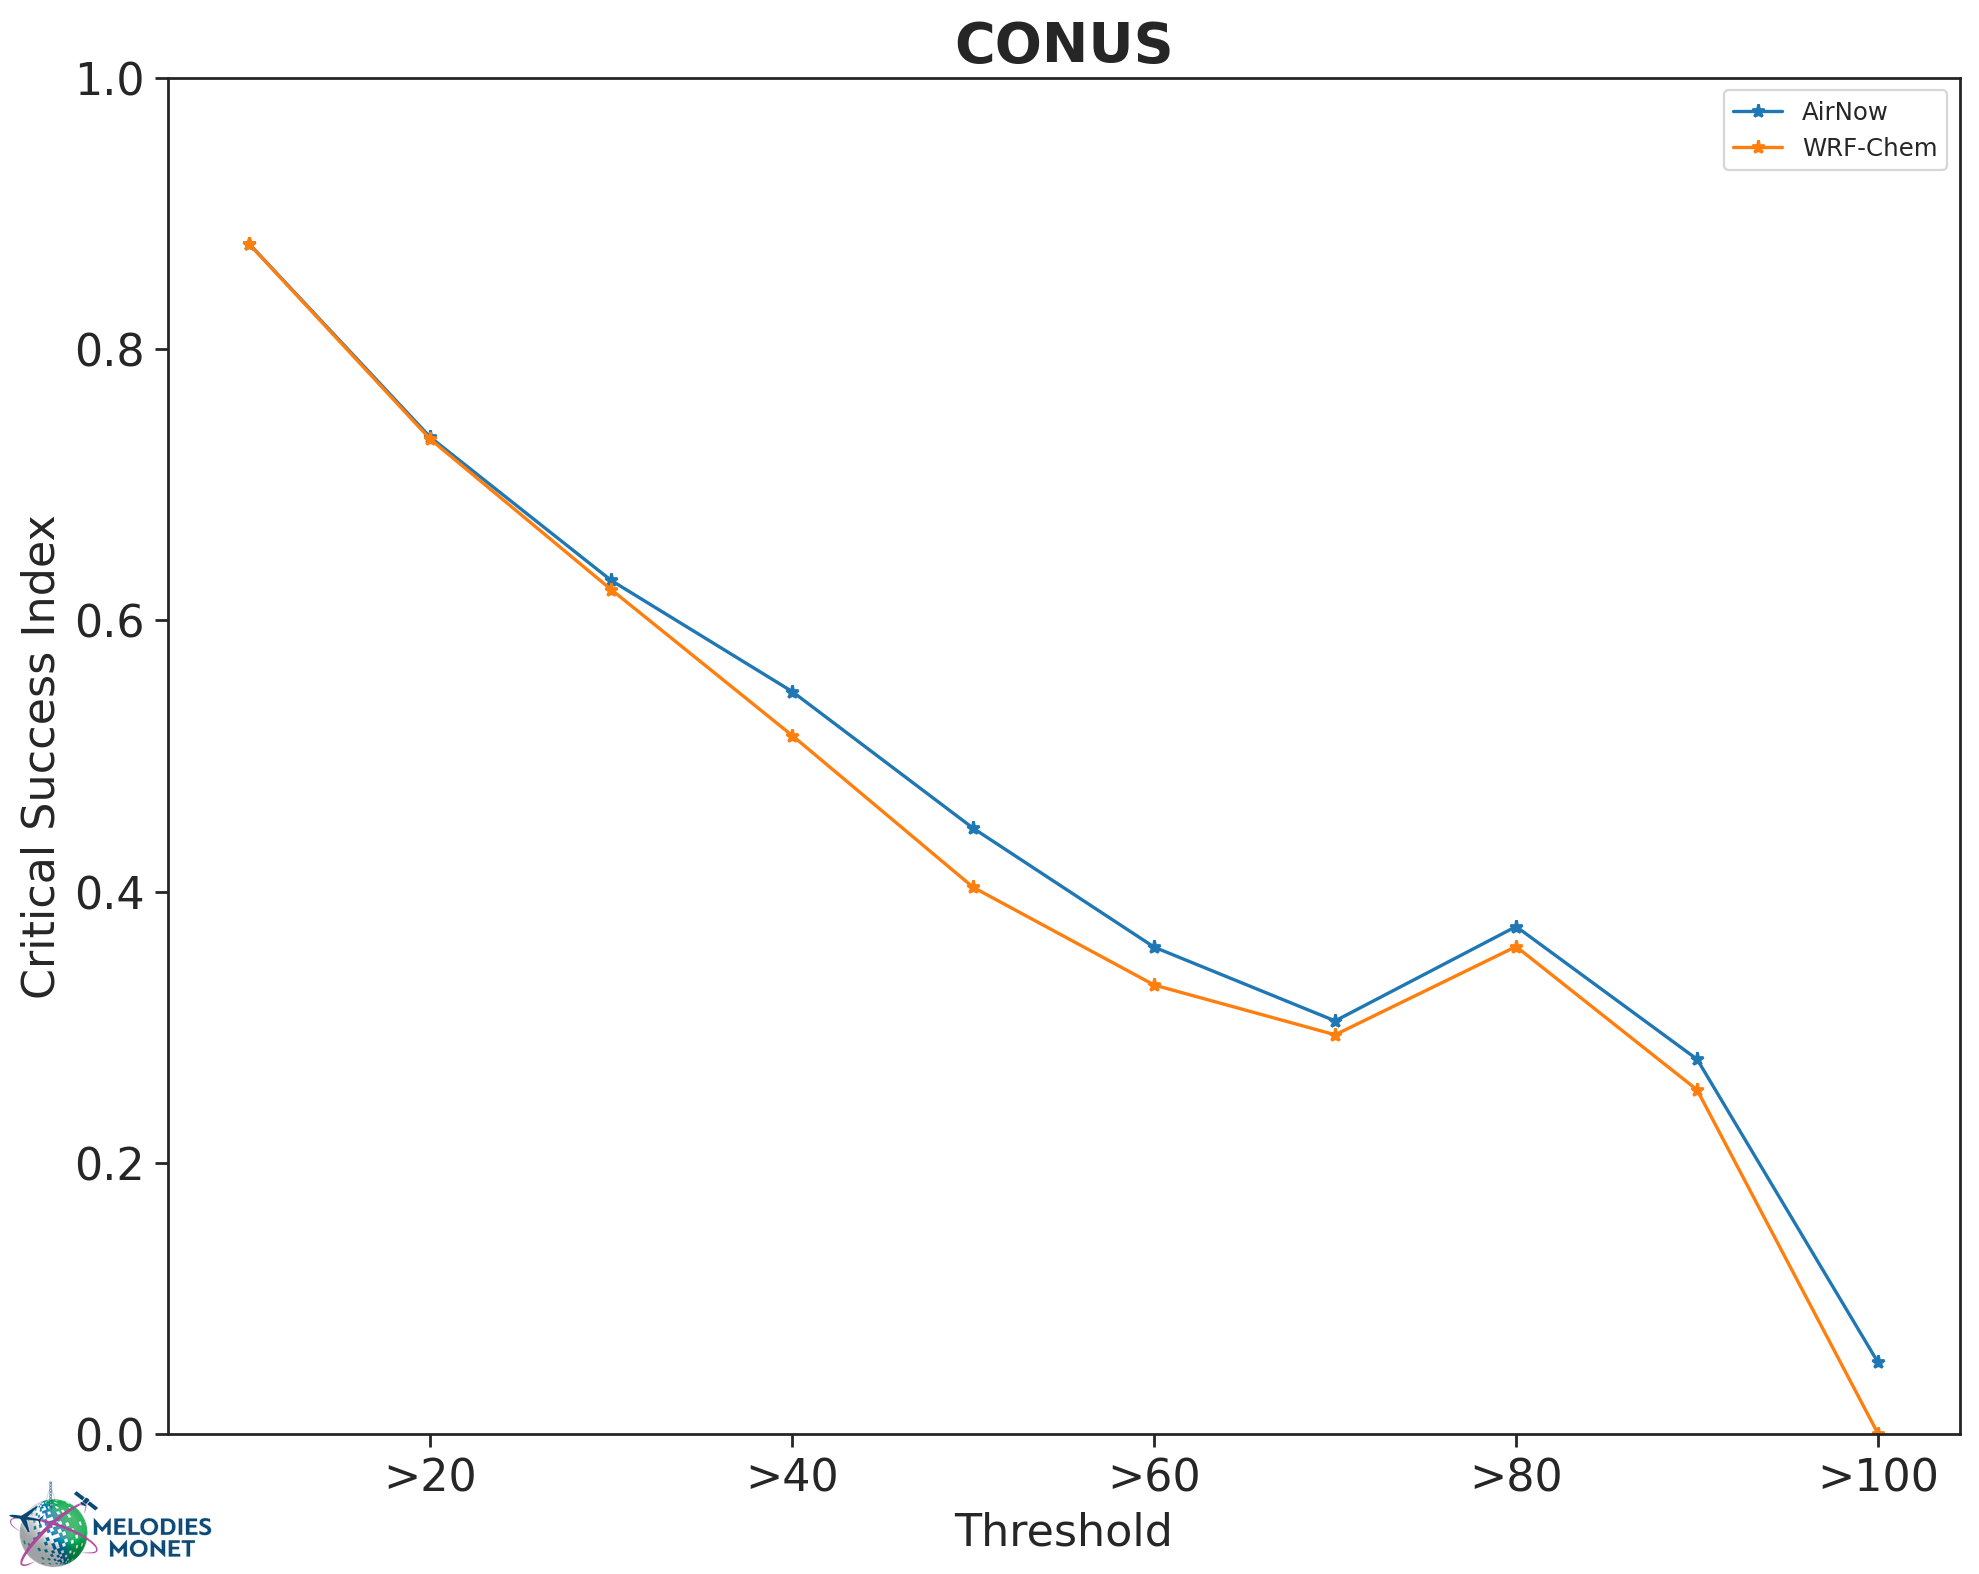
Critical Success Index Plot of the Critical Success Index, as commonly used in Forecast evaluation.
See the Expand Surface Observations in MELODIES-MONET project on GitHub to learn about current and future development.
Aircraft Evaluation
Under development.
See the Incorporate Aircraft Evaluation in MELODIES-MONET project on GitHub to learn about current and future development.
Satellite Evaluation
Under development.
See the Incorporate Satellite Evaluation in MELODIES-MONET project on GitHub to learn about current and future development.